

Spot the wasted I/O in your traces. Price it in energy and carbon.
Perf Sentinel catches N+1s, redundant calls, slow queries and fanout in your OpenTelemetry traces, as a CI quality gate or an OTLP daemon, then turns every avoidable I/O into energy and CO₂.

 An open-source project stewarded by
the Institut du Numérique Responsable


CRITN+1 HTTPGET /api/cart/enrich12 calls → 1
11 avoidable calls, fixable at inventory/enrich.py:88. One finding from the demo below, Findings tab.
GET catalog-svc/api/products/{id} · 110 ms · 1 needed, 11 avoidableinventory/enrich.py:88batch endpoint
?ids=…, 12 calls → 1The synoptic shows Perf Sentinel from the inside, from the map of environments down to the detection rules.
Why Perf Sentinel?
I/O anti-patterns hit any app, monolith or microservices. In distributed systems one request cascades across several services, so the waste only shows up when you look at the whole trace.
Perf Sentinel reads the traces your app already emits (SQL, HTTP, broker publishes), whatever the language or ORM: it sees the queries they generate, without needing to know JPA or EF Core.
Each avoidable I/O is also priced in energy and CO₂, bottom-up and attributable to the code.
Prerequisite: your services send OpenTelemetry traces of their database, HTTP and messaging calls, or Datadog traces through an OpenTelemetry Collector.
Check your tracing first: a database or HTTP call recorded without its query or URL is skipped. A thin report can mean a clean app or thin instrumentation.
What it is not: a full APM, a continuous profiler, nor (for now) a standalone regulatory carbon accounting platform. See the comparison.
Maturity: beta, pre-1.0, so commands and configuration can still change. In production with one team since June 2026.
Twelve I/O anti-patterns, at the protocol level
On the SQL and HTTP requests your services already emit, whatever the language or ORM.
Eight repetition and slowness patterns, by protocol:
Example: the N+1 from the demoinventory-svc · GET /api/cart/enrich · 12 calls → 1
GET /api/cart/enrich
inventory/enrich.py:88 with a ?ids=… batch endpoint. The same finding is in the demo, Findings tab.Plus four structural patterns:
Every finding carries: type, severity, normalized template, occurrences, source endpoint, suggestion, source location and GreenOps impact. In daemon mode, cross-trace correlation is added.
Every finding gives its severity, the template at fault, the source endpoint, a fix suggestion and its GreenOps impact.
Works with your languages, frameworks and ORMs
Detection reads the protocol, so it works on any runtime that emits OpenTelemetry traces. The ones below also have a setup guide or fix hints written for them.
Setup guides by language →1 binary, 2 modes, 4 ways to deploy
With an AI coding assistant
A plugin brings Perf Sentinel into the change you are working on. It asks before every change it makes.
Available today for Claude Code.
- before production
/perf-sentinel:perf-testsWrites performance integration tests for your current change, runs them under Perf Sentinel and, if you agree, wires them into your CI.
- in production, with the Hub
/perf-sentinel:prod-findingsReads your services’ findings from the Hub, ranks them by avoidable I/O and fixes them in small batches, each proved by a non‑regression test.
Published by the Perf Sentinel project, independent of Anthropic. Claude Code is an Anthropic product.
A single Rust binary, measured
The figures below time the analysis pipeline alone (single-threaded, on synthetic datasets), so they isolate pipeline cost, not end-to-end throughput.
Full benchmarks in the docs →A C# Hub, for finding history
 .NET SDK 10.0.403
In daemon mode, Perf Sentinel holds findings in memory, oldest evicted first, and /api/findings answers at most 1,000 rows: current state, not history. The Hub, a separate service, collects from every daemon and keeps what an eviction or restart would erase, such as when a finding first appeared. It also receives the periodic reports a scheduled job publishes, checks them, renders their PDF and shares them under an expiring link. Its recap ranks what to fix first and what moved, in an engineering and a management view, and a confirmed fix becomes a signed share card.
In daemon mode, Perf Sentinel holds a bounded number of findings in memory: current state, not history. The Hub, a separate service, collects from every daemon and keeps what an eviction or restart would erase. It also checks and shares the periodic reports, ranks what to fix first in a recap for engineers and management, and signs share cards.
What to fix first, down to the line of code
For the team review, the Hub ranks findings by avoidable I/O over the period and gives each one its fix, its place in the code and its signature. Trends count closed days only. No AI writes it: every sentence comes from the engine’s rules.
- 1N+1 SQLShowing a cart
shopGET /cart/{id}Use
WHERE ... IN (?)to batch 41 queries into one1.9 millionavoidable I/Omore than in JuneHow to fix
SELECT * FROM cart_item WHERE cart_id = ?
Suggested fixjava_jpaUse
JOIN FETCHon the relationship or annotate the repository method with@EntityGraphto load associations in a single query.Where in the codeCartItemRepository.findByCartId shop/src/main/java/acme/cart/CartItemRepository.java:31
- detections
- 1,284
- confidence
- daemon_production
- signature
n_plus_one_sql:shop:GET__cart_{id}:09908701485122dcb9d5d84b7c653b7c
- 2N+1 messagingConfirming an order
checkoutPOST /orders/{id}/confirmSend 12 messages as one batch instead of one publish per item
412,000avoidable I/Onew this month - 3Redundant HTTPOpening the settings
accountGET /api/settingsIdentical operation executed 3 times: cache result or deduplicate
96,000avoidable I/Ofewer than in June
The carbon weight of digital,
and its blind spot: application code
Digital already accounts for 1.8% to 3.9% of global greenhouse-gas emissions, on par with civil aviation and growing fast. But the share driven by bloated, poorly optimized code and web apps stays unquantified at scale.
Published estimates cover data centers, networks and devices. None of them goes down to a single query or endpoint.
Perf Sentinel’s bottom-up approach against the top-down of current tools
Every avoidable I/O has a cost,
in time, energy and carbon
Cutting N+1s and redundant calls improves response times and energy use at the same time. co2.total follows the Software Carbon Intensity v1.0 numerator (ISO/IEC 21031:2024): energy used (E) times the electricity grid carbon intensity (I), plus embodied hardware emissions (M), summed over the analyzed traces.
Cutting N+1s and redundant calls improves response times and energy use at the same time. co2.total follows the Software Carbon Intensity v1.0 method (ISO/IEC 21031:2024), summed over the analyzed traces.
co2.avoidable: the share due to avoidable I/O, embodied excludedI/O intensity score (IIS)
I/O waste ratio
Multi-region co2.total
cloud.region.Directional estimate, enough to prioritize and compare before and after. A measured energy sourceA measured energy source (daemon mode) sharpens E. Activity data for Watershed · Sweep · Greenly · Persefoni, or RGESN work. Also emits periodic public energy and carbon reports (quarterly or yearly, as JSON and PDF/A-3b, optional Sigstore signature, hash-verifiable).
A directional estimate, enough to prioritize and compare before and after. A measured energy source sharpens it. It also serves as activity data for your carbon tools or RGESN work, and can be published as a periodic report.
From estimate to measurement,
where your infrastructure allows it
By default, energy is estimated from I/O: a directional figure, within 2×. In daemon mode, it can come from a measurement, with the grid’s live carbon intensity. The JSON report names its source.
Replaces the built-in carbon intensity with the live value for the zone your services run in, the biggest lever on gCO₂ where the electricity mix varies.








Independent of the energy source: it combines with any option above, or with the default estimate. Where both cover a zone, Electricity Maps wins. Where neither covers it, the built-in table applies.
Software measurement is not a power meter: RAPL sees only CPU and memory, roughly half to two thirds of wall-plug draw. Only Redfish also sees fans, disks and network cards.
Measurement sources and precision in the docs →Lightweight, agnostic, CI-native, carbon-aware
‘Typical commercial APM’: agent-based SaaS tools such as Datadog and New Relic, varying by product. The agent figure, published by Datadog for Agent 7.34, excludes the per-service tracer, as Perf Sentinel’s excludes the OTel instrumentation it reads. Not a full APM: it runs alongside an observability suite, not instead of it. Per-tool comparison (Sentry, Hypersistence, Digma, Pyroscope, OTJAE) in the docs.
‘Typical commercial APM’: agent-based SaaS tools such as Datadog and New Relic. Perf Sentinel runs alongside an observability suite, not instead of it.
What Perf Sentinel is not
A report anyone can check
The daemon archives every analysis window. perf-sentinel disclose turns them into a quarterly or yearly report, and disclose-pdf renders it as a PDF/A-3b. The Hub can receive and share it, but nobody needs it to verify one.
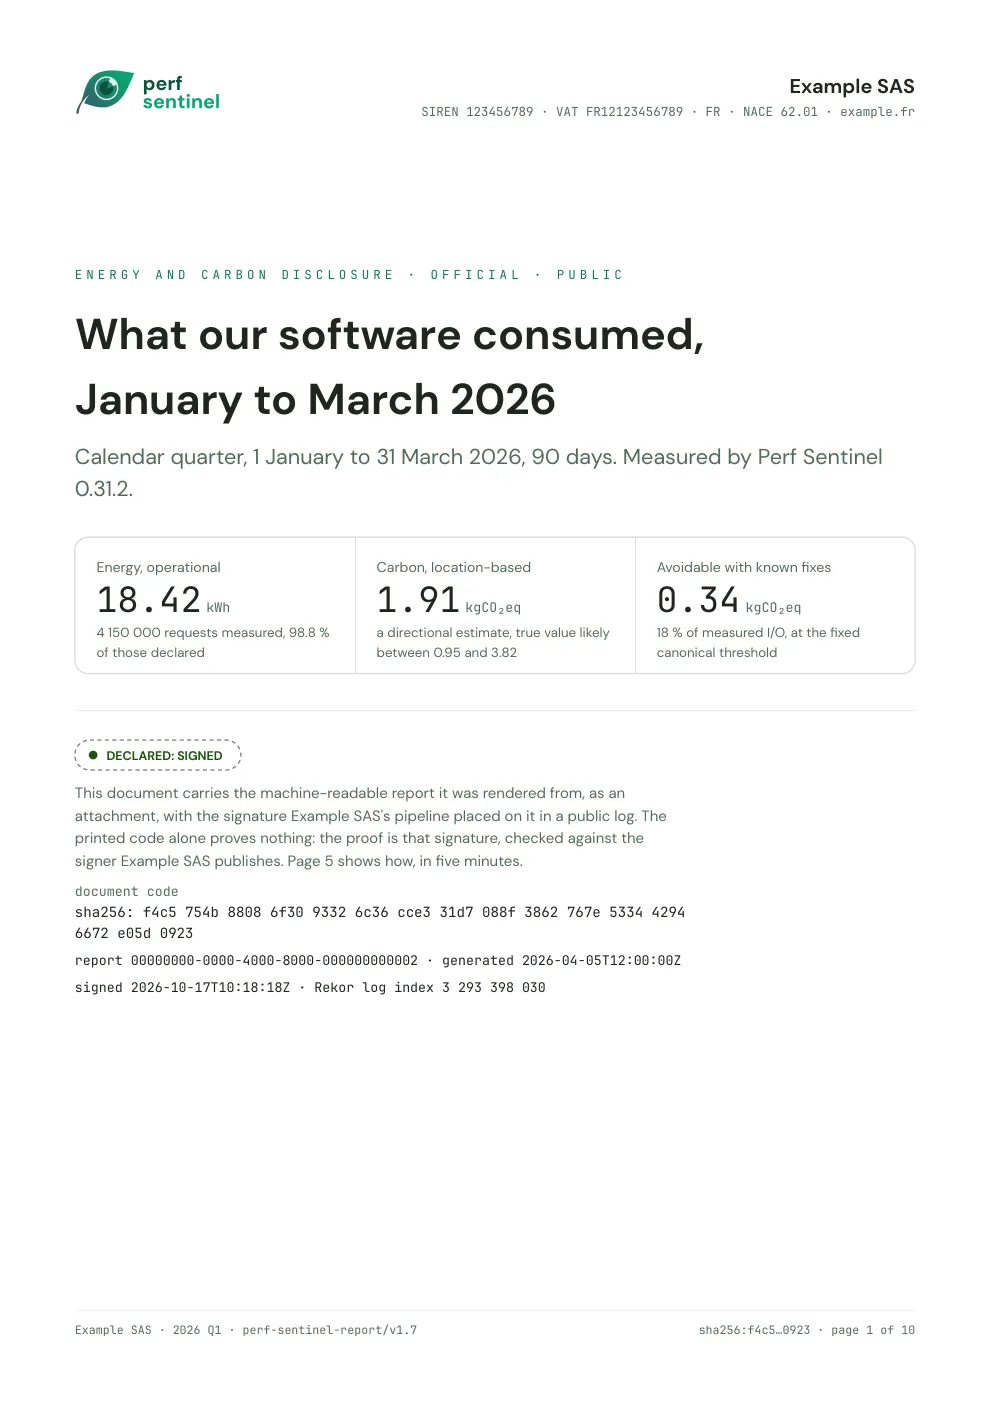
A ten-page PDF anyone can read without a tool: the quarter’s figures and their uncertainty, the scope measured, the limits of the method, and an annex of every field in the report. The source report and its signature travel as attachments, and one command rechecks all of it.
- PDF/A-3b
- 10 pages
- signed (Sigstore)
- fictional company
Verify it yourself
After the download, one command recomputes the hash of the attached report, checks that the attestation names it and checks the signature, with cosign on the PATH.
One command, with cosign on the PATH, recomputes the hash of the attached report and checks its signature.
AGPL-3.0, and what it means for your code
A legal-team-friendly summary, no repository digging needed. Perf Sentinel is licensed under the GNU Affero General Public License v3.0.
Running Perf Sentinel does not place your own services under AGPL. It is a standalone process: your applications only send it OpenTelemetry traces over the network (OTLP), a remote communication and not a compile-time link, so it creates no derivative work and imposes no licensing obligation on your code.
The AGPL covers Perf Sentinel’s own source code. Using the official binaries or container image unmodified triggers no copyleft obligation of any kind.
The one condition: if you modify Perf Sentinel and offer the modified version to third parties over a network, article 13 requires you to make that modified source available to those users. This is a practical summary, not legal advice. Consult your legal team if in doubt.
The one condition: if you modify Perf Sentinel and offer that version to third parties over a network, article 13 requires you to publish its source. A practical summary, not legal advice.
What your security team will check, and where to find it
Perf Sentinel and its Hub install on your infrastructure, no SaaS. What a security review usually covers: on by default, or left to you.
Queries normalized in memory
The engine replaces SQL values and URL identifiers with placeholders in memory, with documented exceptions. The Hub keeps these findings 180 days by default, in a SQLite database on your side.
SQL values and URL identifiers replaced, with documented exceptions. The Hub keeps findings 180 days by default, on your side.
No telemetry
The engine only reaches what you configure, such as an energy measurement source. The Hub checks GitHub once a day for the latest version, and one setting turns it off.
The Hub checks GitHub once a day for the latest version, and one setting turns it off.
What is open, and how to close it
The daemon listens on 127.0.0.1 by default, TLS optional. Its reads are not authenticated: a NetworkPolicy or your ingress filters them. The Hub requires a key per source and can put its UI behind your SSO.
The daemon’s reads are not authenticated: a NetworkPolicy or your ingress filters them. The Hub requires a key per source.
Rust without unsafe, rootless images
The engine’s core forbids unsafe code at compile time. Both images run without root, FROM scratch for the engine and chiseled for the Hub, read-only in their Helm charts.
FROM scratch for the engine, chiseled for the Hub, read-only in their Helm charts.
Signed tags, traceable binaries
Signed release tags, build provenance attested through Sigstore and an SPDX SBOM with every version. Actions pinned by SHA, dependencies audited daily.
Build provenance attested through Sigstore and an SPDX SBOM with every version.
Private reporting, published response times
Vulnerabilities are reported privately through GitHub. Each repository publishes its response times and the versions that receive fixes.
Each repository also publishes the versions that receive fixes.


Stewarded by the Institut du Numérique Responsable
Started as a personal project, Perf Sentinel has joined the INR, a French non-profit that grew out of the Club Green IT. Its creator, Robin Trassard, still leads it within the institute. Robin is also a full-stack developer at Onepoint, back-end leaning and specialized in performance and eco-design. The code stays under AGPL-3.0 and is developed in the open on the INR GitHub.