

Get perf-sentinel running
A single self-hosted binary that reads the OpenTelemetry traces your services already emit, flags wasteful I/O, and prices it in energy and carbon. From first run to CI gate.
Quickstart
Five steps, from the built-in demo to a live daemon. Nothing to install on your application side, but your spans must already carry the query text (db.statement) and the target URL (http.url): spans without those attributes are dropped silently, so audit your own tracing first with perf-sentinel inspect.
demo --html is a full showcase: every dashboard tab is populated (Overview, Findings with inline Explain, Carbon, pg_stat, mysql_stat, Diff and synthesized cross-trace correlations).
On dd-trace? Bridge it through the Collector datadogreceiver, then either feed its file exporter OTLP JSON straight to analyze --input for batch (auto-detected), or stream to the watch daemon over OTLP. See Coming from Datadog.
Installation
Pick crates.io, a prebuilt binary, or the container image. Linux binaries target musl, so they are static and run on any distribution, including FROM scratch images.
A Helm chart is published for Kubernetes deployments. Container images are available on ghcr.io and Docker Hub.
Configuration
Drop a .perf-sentinel.toml at the repository root. Thresholds drive the CI gate; detection tunes how anti-patterns are flagged.
CLI reference
One binary, a handful of subcommands. Run perf-sentinel <cmd> --help for the full flag list.
perf-sentinel demo --html demo.htmlperf-sentinel analyze --input traces.json --ciperf-sentinel watch --listen-address 0.0.0.0perf-sentinel report --input traces.json --output report.htmlpg_stat_statements hotspots, ranked by total time.
performance_schema digests, ranked by total time.
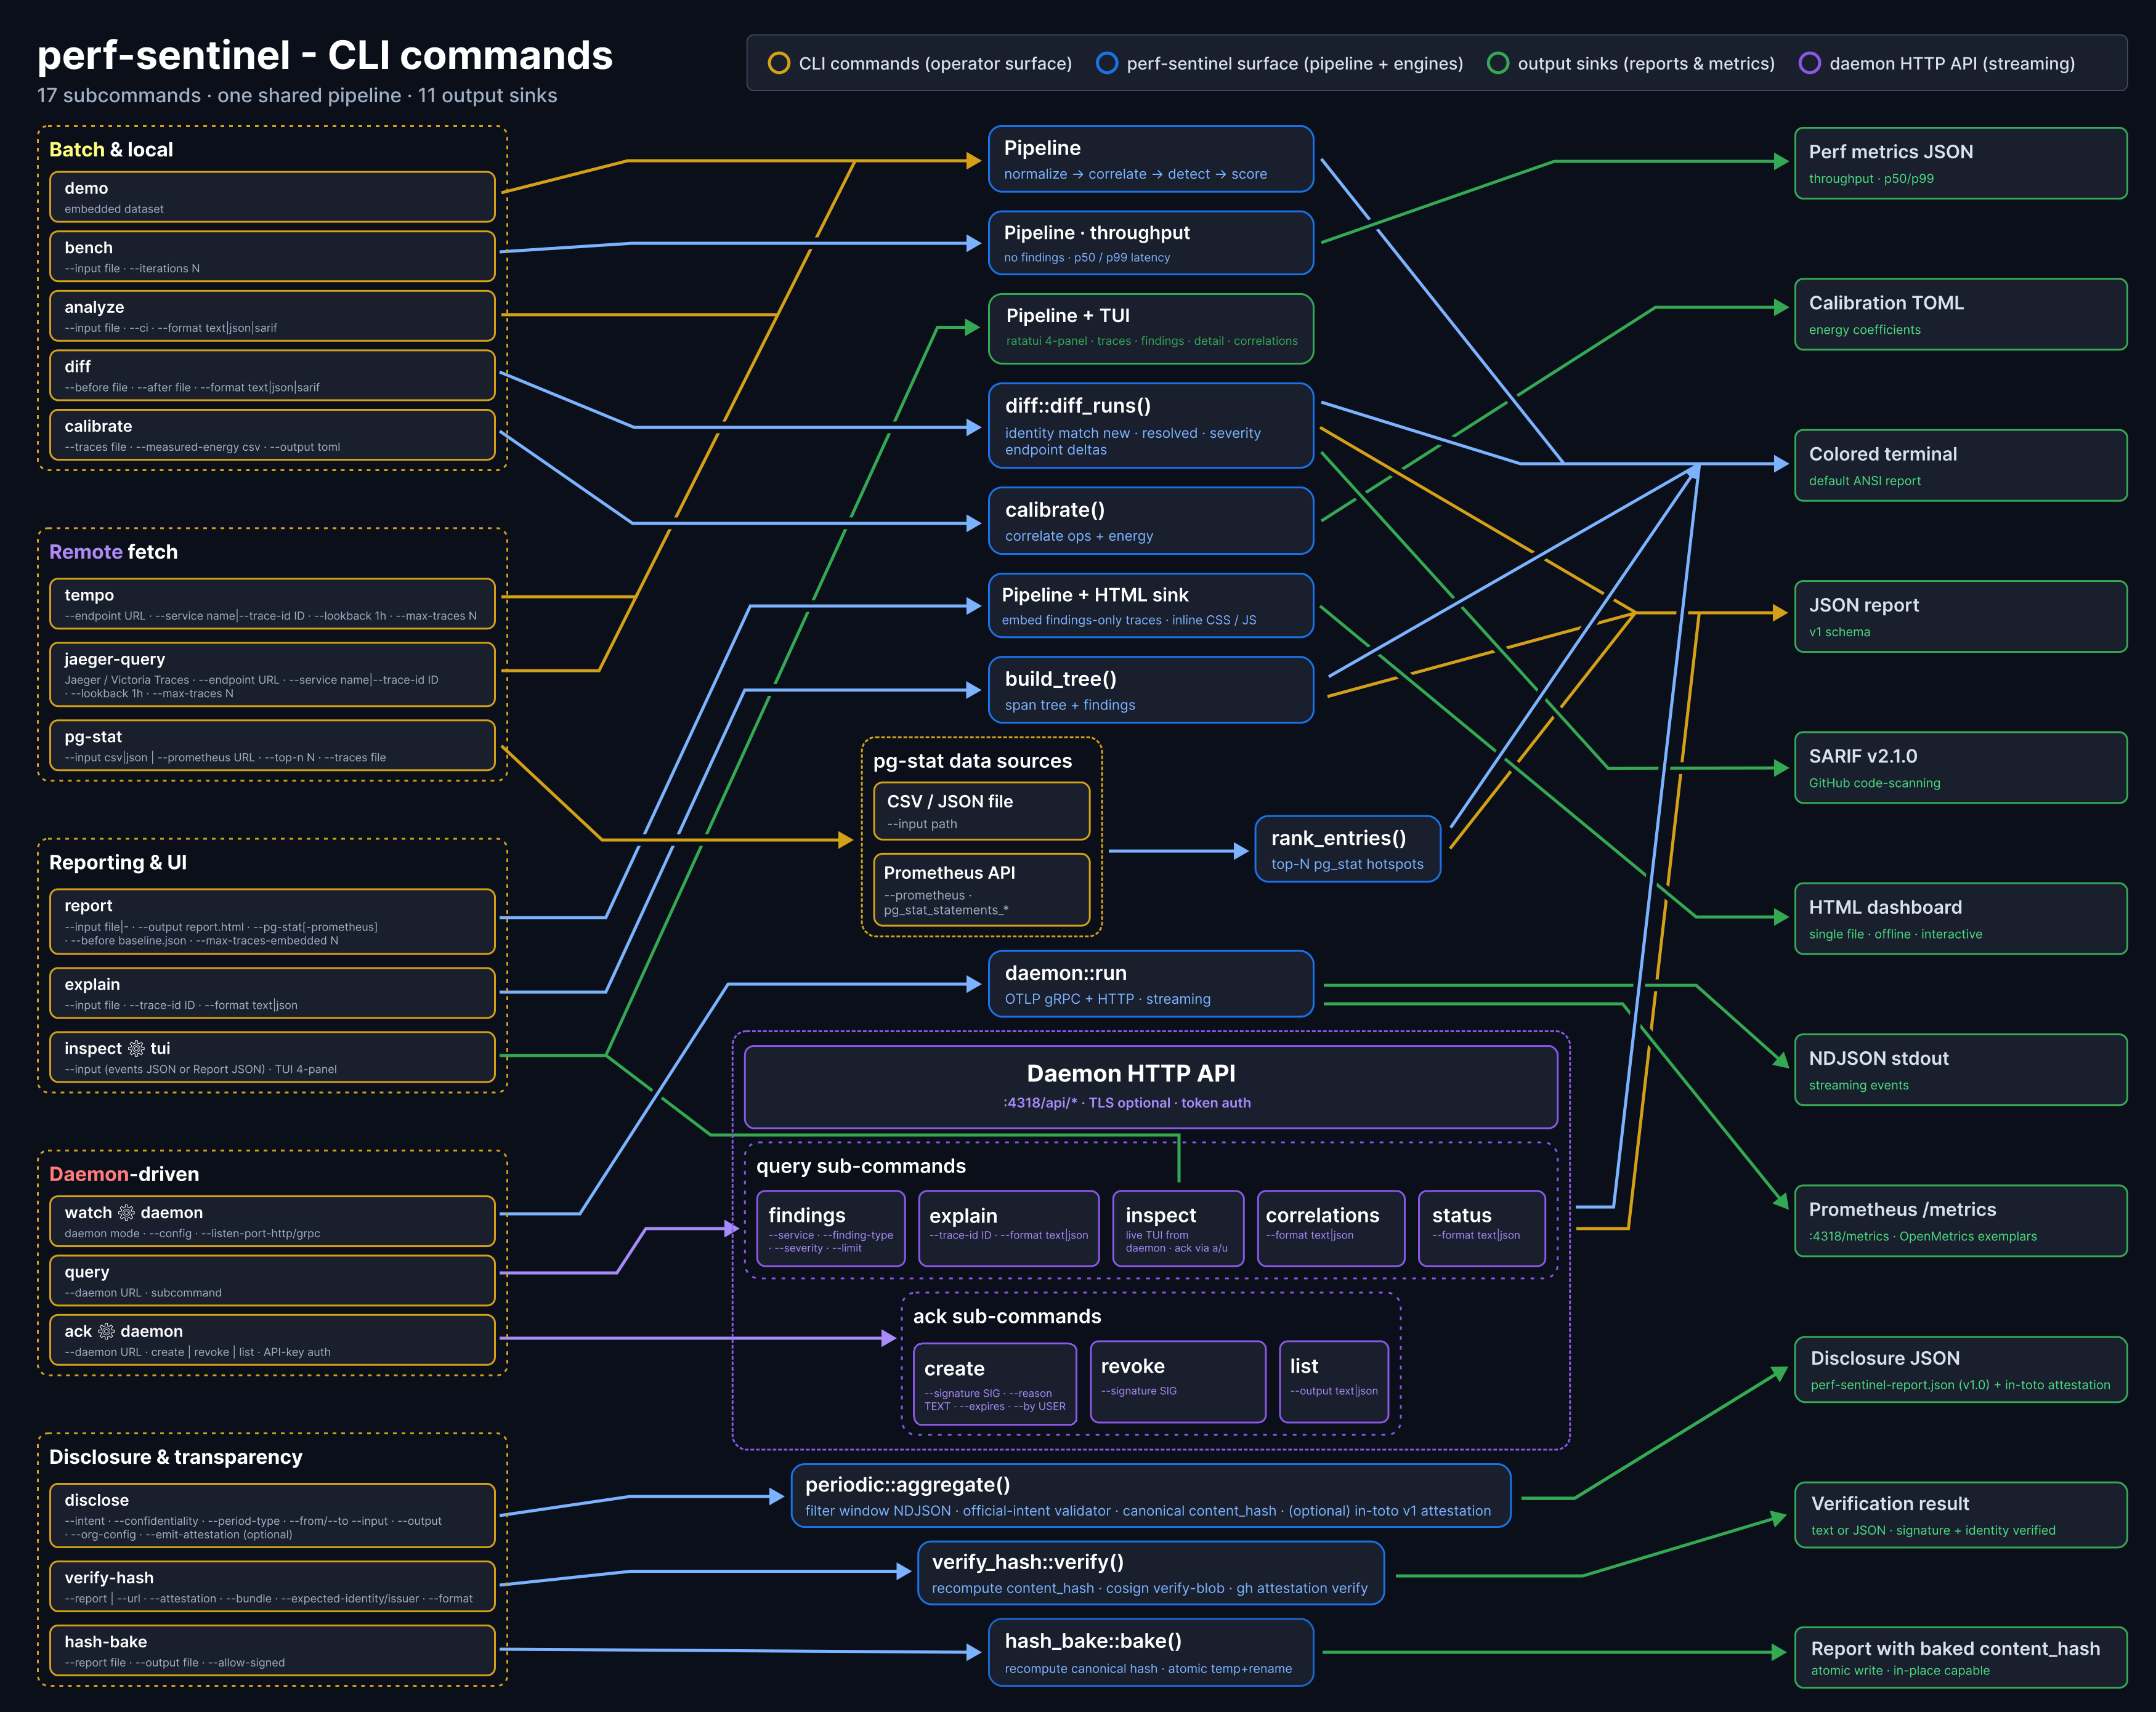
The whole CLI surface in one map (18 subcommands, one pipeline, 11 outputs)
Input & output formats
Traces come in from files or live OTLP; results go out as terminal text, machine-readable JSON/SARIF, an HTML dashboard, or live daemon streams. Output is deterministic: identical input yields byte-identical JSON and SARIF, findings sorted on a stable key rather than HashMap order, so a CI quality gate never flickers.
datadogreceiver, see Coming from Datadog.pg_stat_statementsperformance_schemaGreenOps metrics
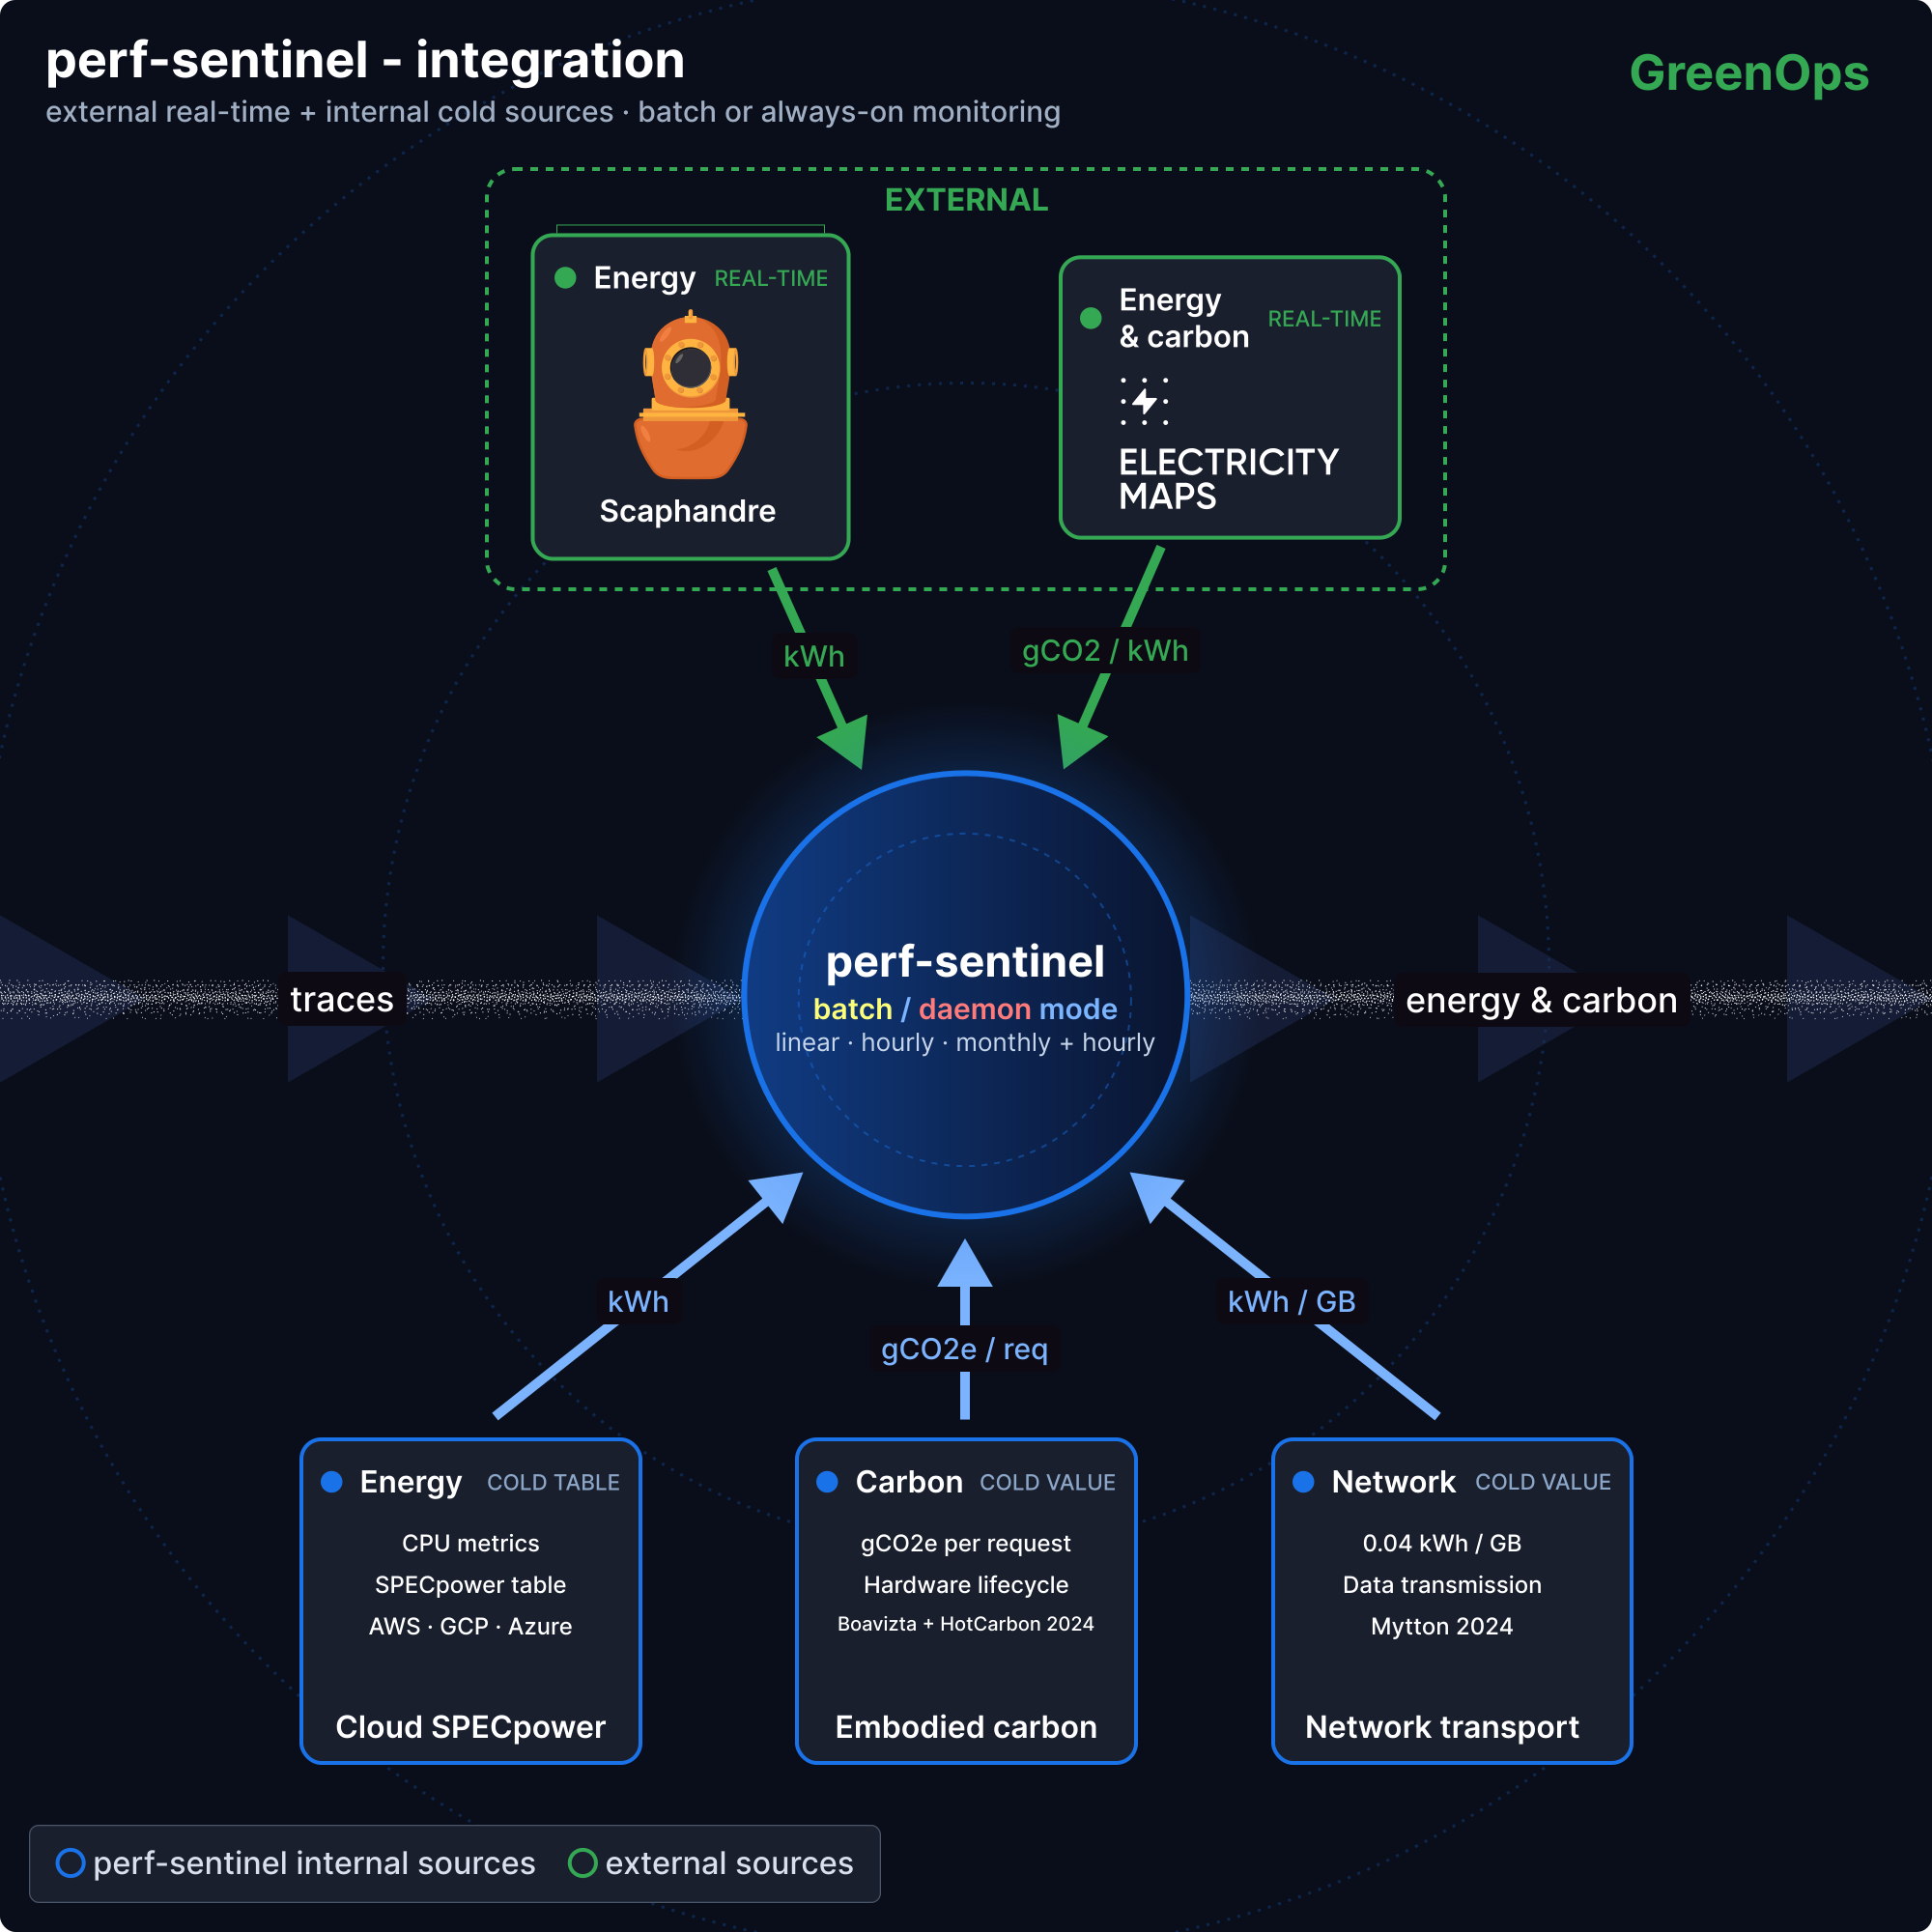
Every finding carries a GreenOps reading. The figures are directional and meant to rank and trend, not to certify (for now).
io_intensity_band and io_waste_ratio_band enum values are stable across versions; the underlying numeric thresholds may evolve.Which energy source on which infrastructure
No infrastructure prerequisite: the I/O proxy model and the embedded grid tables produce estimates from the first trace, and measured sources refine them where the infrastructure allows. When several sources cover one service, the most precise wins automatically, per service.
The carbon side prices the detected I/O with the rigor of a specialized software and compute emissions calculator: activity-based methodology, region-hourly grid intensity (Electricity Maps, ENTSO-E, RTE, National Grid ESO, EIA, and more), bottom-up embodied carbon (Boavizta and HotCarbon 2024) and Sigstore-signed, hash-verifiable disclosures.
It is suitable as a primary data source for a horizontal carbon accounting platform, or as an internal controlling tool for software-emissions KPIs and RGESN conformance.
It is not yet third-party verified for standalone CSRD or GHG Protocol Scope 2/3 inventory reporting, which requires audit by a qualified body and integration with non-IT scopes. CO₂ figures carry a ~2× uncertainty bracket in the default proxy mode, tighter with any measured-energy source (Alumet or Scaphandre RAPL, Kepler eBPF, Redfish BMC, or cloud SPECpower with calibration). Sources and bounds: estimate accuracy and the methodology.
Energy & carbon, in plain language →
Concrete pairings: pass the I/O counts and per-region energy estimates to Watershed, Sweep, Greenly or Persefoni as activity data, or use perf-sentinel directly to demonstrate RGESN (Référentiel Général d’Écoconception de Services Numériques, ARCEP/Ademe/DINUM 2024) software-optimization conformance, where N+1 detection, redundant calls, caching and fanout reduction map onto the corresponding criteria.
For organisations who still want a non-regulatory periodic efficiency disclosure (quarterly or yearly JSON, optional Sigstore signature, intentionally kept off the main quickstart path), the optional perf-sentinel disclose workflow is documented in the disclosure guide.
Performance
perf-sentinel bench times the analysis pipeline only (normalize → correlate → detect → score), single-threaded, on synthetic datasets: the pure pipeline cost, not end-to-end throughput nor a daemon-under-load benchmark.
- x86: GCP c3-standard-8 (Xeon 8481C @ 2.70 GHz, 8 vCPU), measured June 2026.
- M4: Mac mini M4 Pro (12 cores, 24 GB), measured 2026-06-08.
Both release 0.8.5 (musl+mimalloc on x86, system allocator native on M4). With the native artifacts the M4 Pro sustains about 2.1× one 8481C vCPU (2.14× repeated, 2.08× varied). p50 / p99 are per-event latency over 10 iterations. Daemon memory: ~17 MB RSS at rest, peaking ~190 MB under a sustained ~1.0M evt/s ingestion load (down from 237 MB on 0.6.1, under the 250 MB ceiling). Those are lab figures with an empty findings ring, and they are not what you size a pod with: the memory note below has the production numbers. Rust edition 2024, rustc 1.96.0. Reproduce with perf-sentinel bench --help.
Bench methodology (clock scope, datasets)
File reads, JSON parsing and ingestion all happen before the clock starts, and input batches are cloned up front. The pipeline is single-threaded (no rayon), so core count does not change throughput. Both datasets are 44,043 synthetic events built by duplicating the demo fixture, one repeats the same pattern, the other uses random SQL per query. This isolates pipeline throughput but does not reflect real-production diversity.
Same-chip allocator breakdown
The x86 musl artifact links mimalloc while the macOS arm64 artifact uses the system allocator, so cross-platform binaries differ by allocator as well as ISA. On the same M4 Pro the musl+mimalloc build (the linux/arm64 artifact in a Docker container) reaches ~1.39M / ~1.51M evt/s versus ~1.23M / ~1.33M native, about 13% faster, confirming the allocator as the main cause of higher Docker throughput. At equal build (both musl+mimalloc), the M4 Pro is ~2.4× the x86 8481C (2.41× repeated, 2.36× varied).
Memory: lab idle vs a production daemon
bench prints rss_peak_bytes, but that is dominated by the pre-cloned input batches (10 iterations × 44,043 events), not the daemon footprint, and it is not comparable across operating systems (current RSS from /proc on Linux, peak RSS via getrusage on macOS). Profiled separately on the same M4 Pro in a Docker Desktop linux/arm64 VM, the daemon idles at ~17 MB in musl+mimalloc (~10 MB native, mimalloc trades a little RSS for allocator speed) and peaks ~190 MB under a sustained ~1.0M evt/s load, down from 237 MB on 0.6.1, under the 250 MB ceiling.
A production daemon is a different shape. On a Kubernetes StatefulSet running 0.19.0 with max_retained_findings = 100000, process_resident_memory_bytes starts near 88 MB, climbs while the ring fills and then holds: over 7 days, a 980 MB median and a 1.2 GB p90 that is the day-to-day ceiling, with one excursion to 1.8 GB that decayed back over the following day, no restart and no OOM under a 2 GiB limit with a 1 GiB request. Ingestion throughput was not what drove it (30 evt/s median, 520 evt/s p95, 2.1k evt/s peak), the retained findings were, at roughly 3 to 6 KB of RSS each depending on how much evidence a finding carries. So size the pod from max_retained_findings, not from the idle figure: a few hundred MB at the 10000 default, 1 to 2 GB at 100000, and 0 hands the whole store back when the query API is off.
How it compares
perf-sentinel’s niche: lightweight, protocol-agnostic, CI-native and carbon-aware, not a replacement for a full observability suite.
Commercial-APM agent footprints are order-of-magnitude estimates from public deployments; real overhead depends on instrumentation scope.
Acknowledging known findings
Drop a .perf-sentinel-acknowledgments.toml at your repo root to suppress findings the team has accepted: each gets a SHA-256 signature, and they are filtered from analyze / report / inspect / diff and don’t count toward the quality gate. Runtime acks against a live daemon are exposed via the ack CLI, the live HTML dashboard, the TUI, and the findings dashboard, whose Ack column opens the ack page of a PerfSentinelHub that relays to the daemon.
Acknowledgment workflow →Deployment
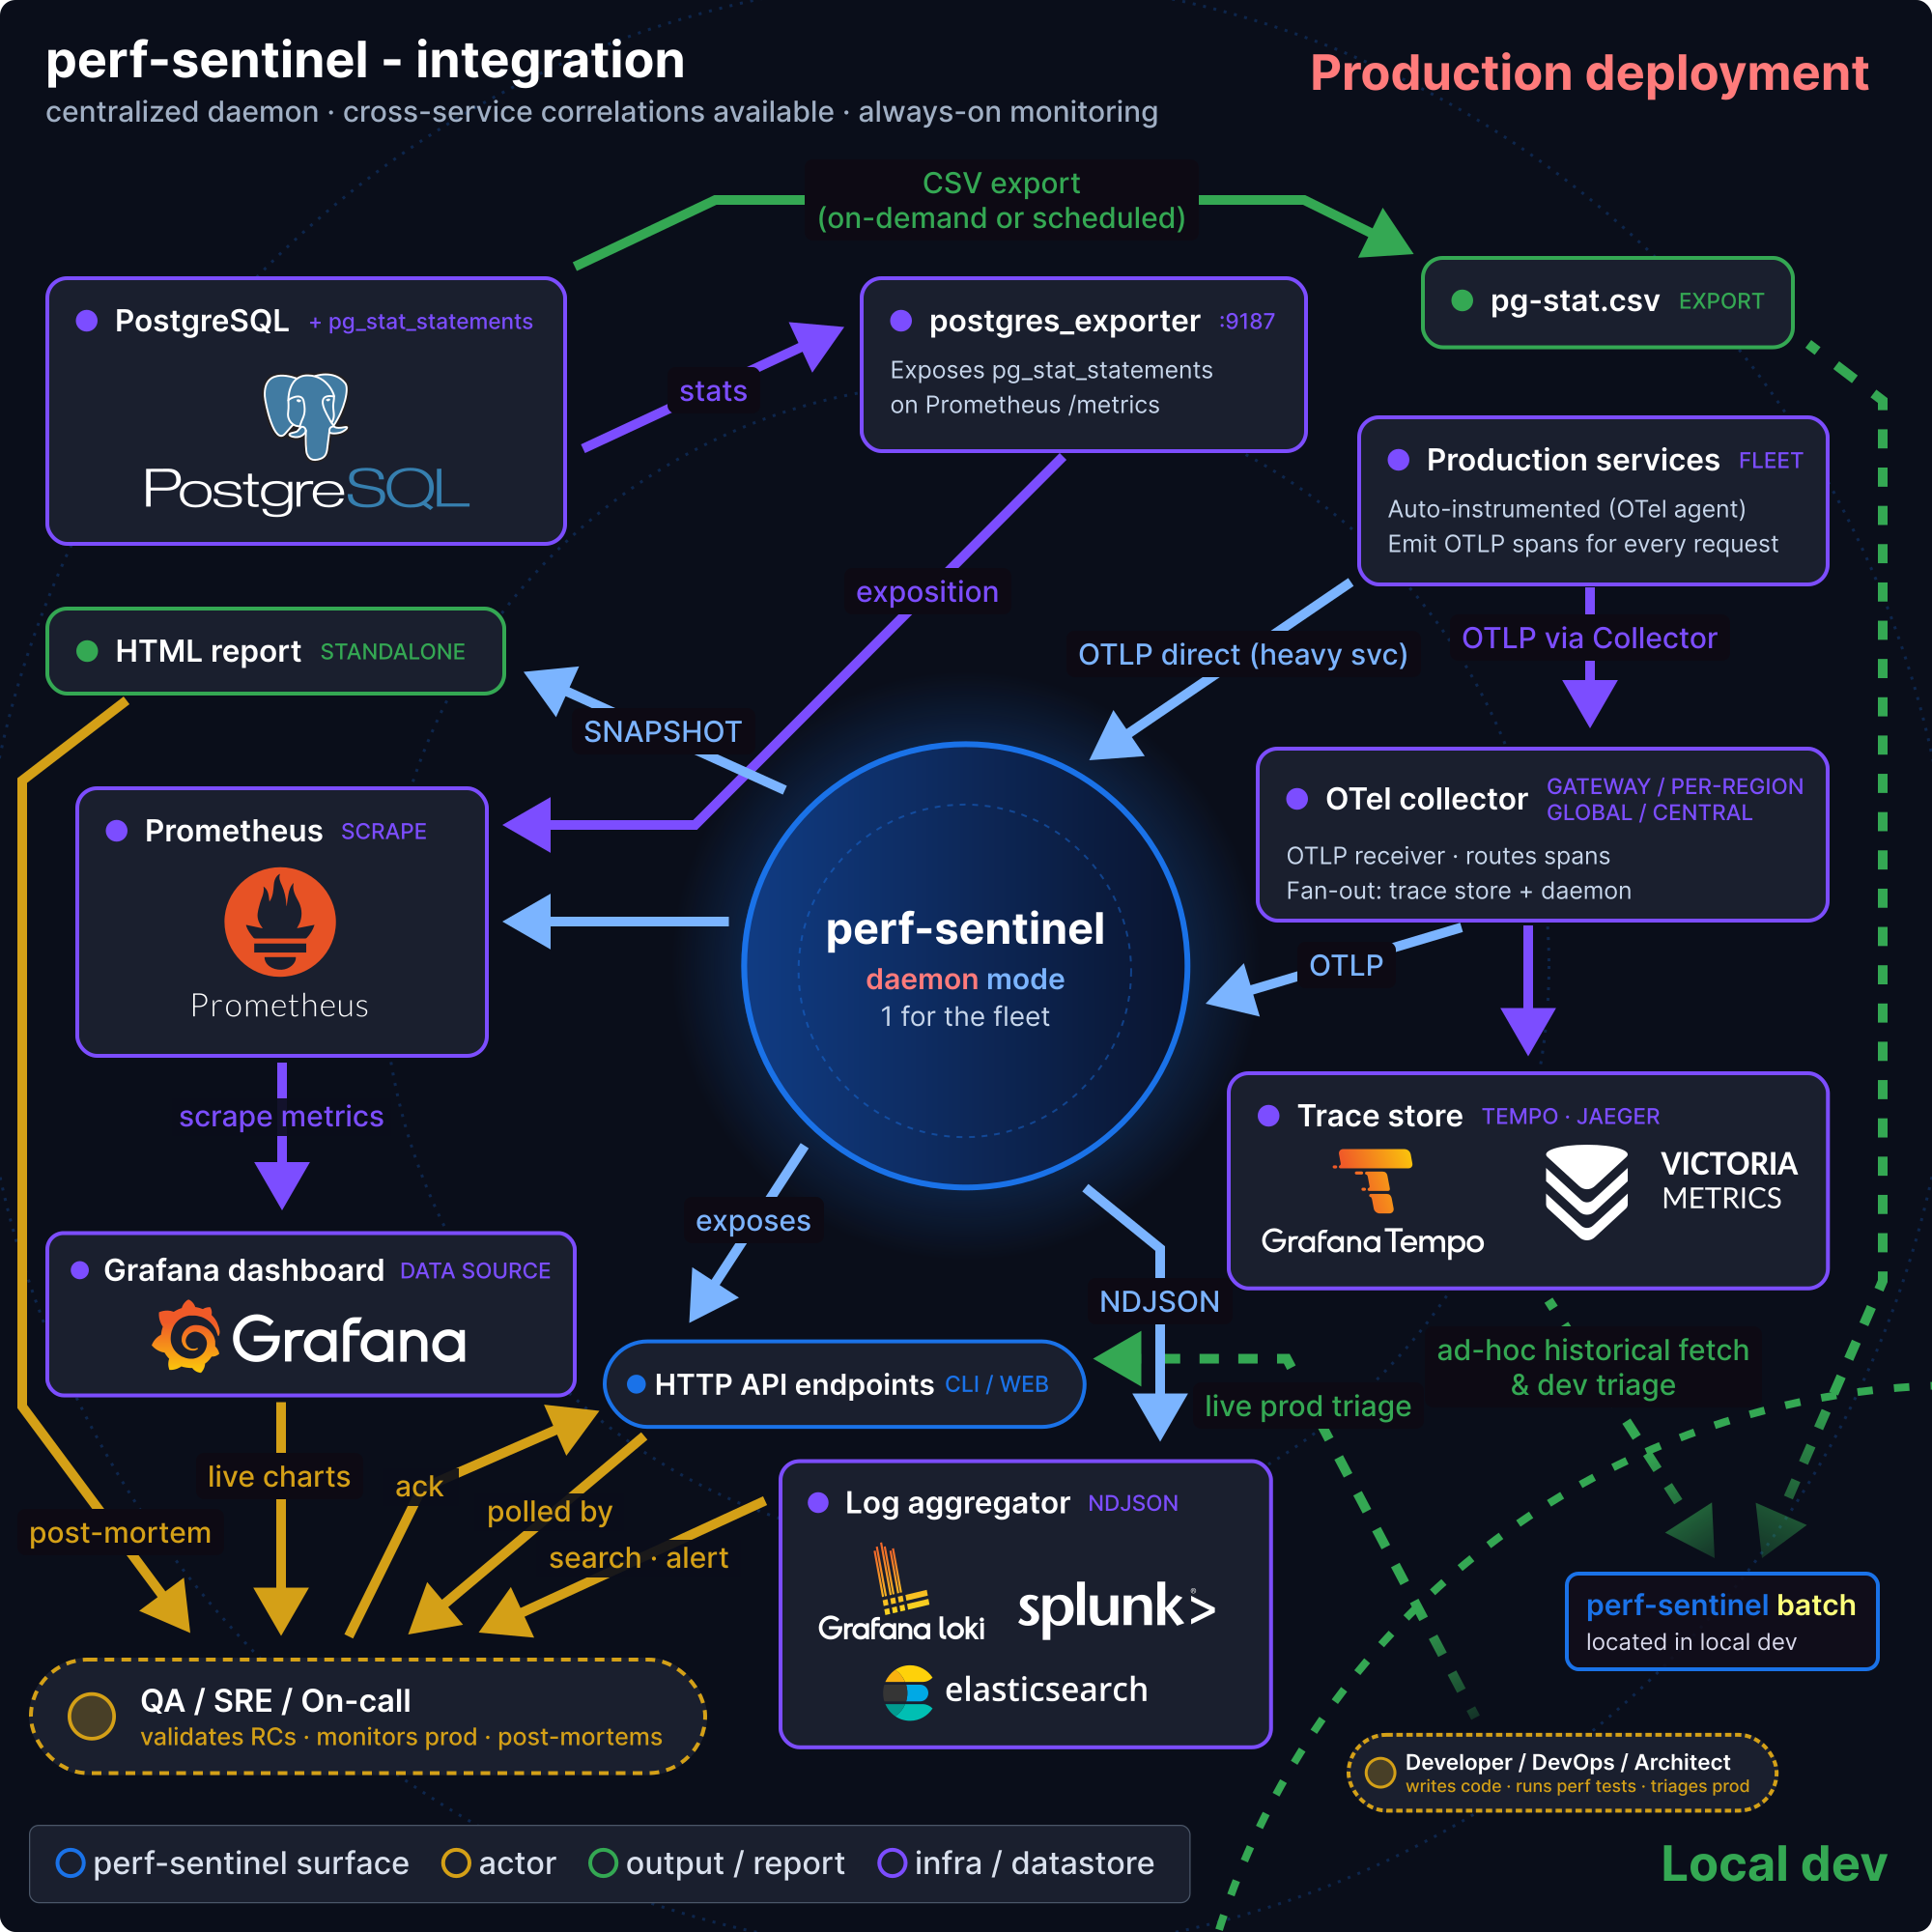
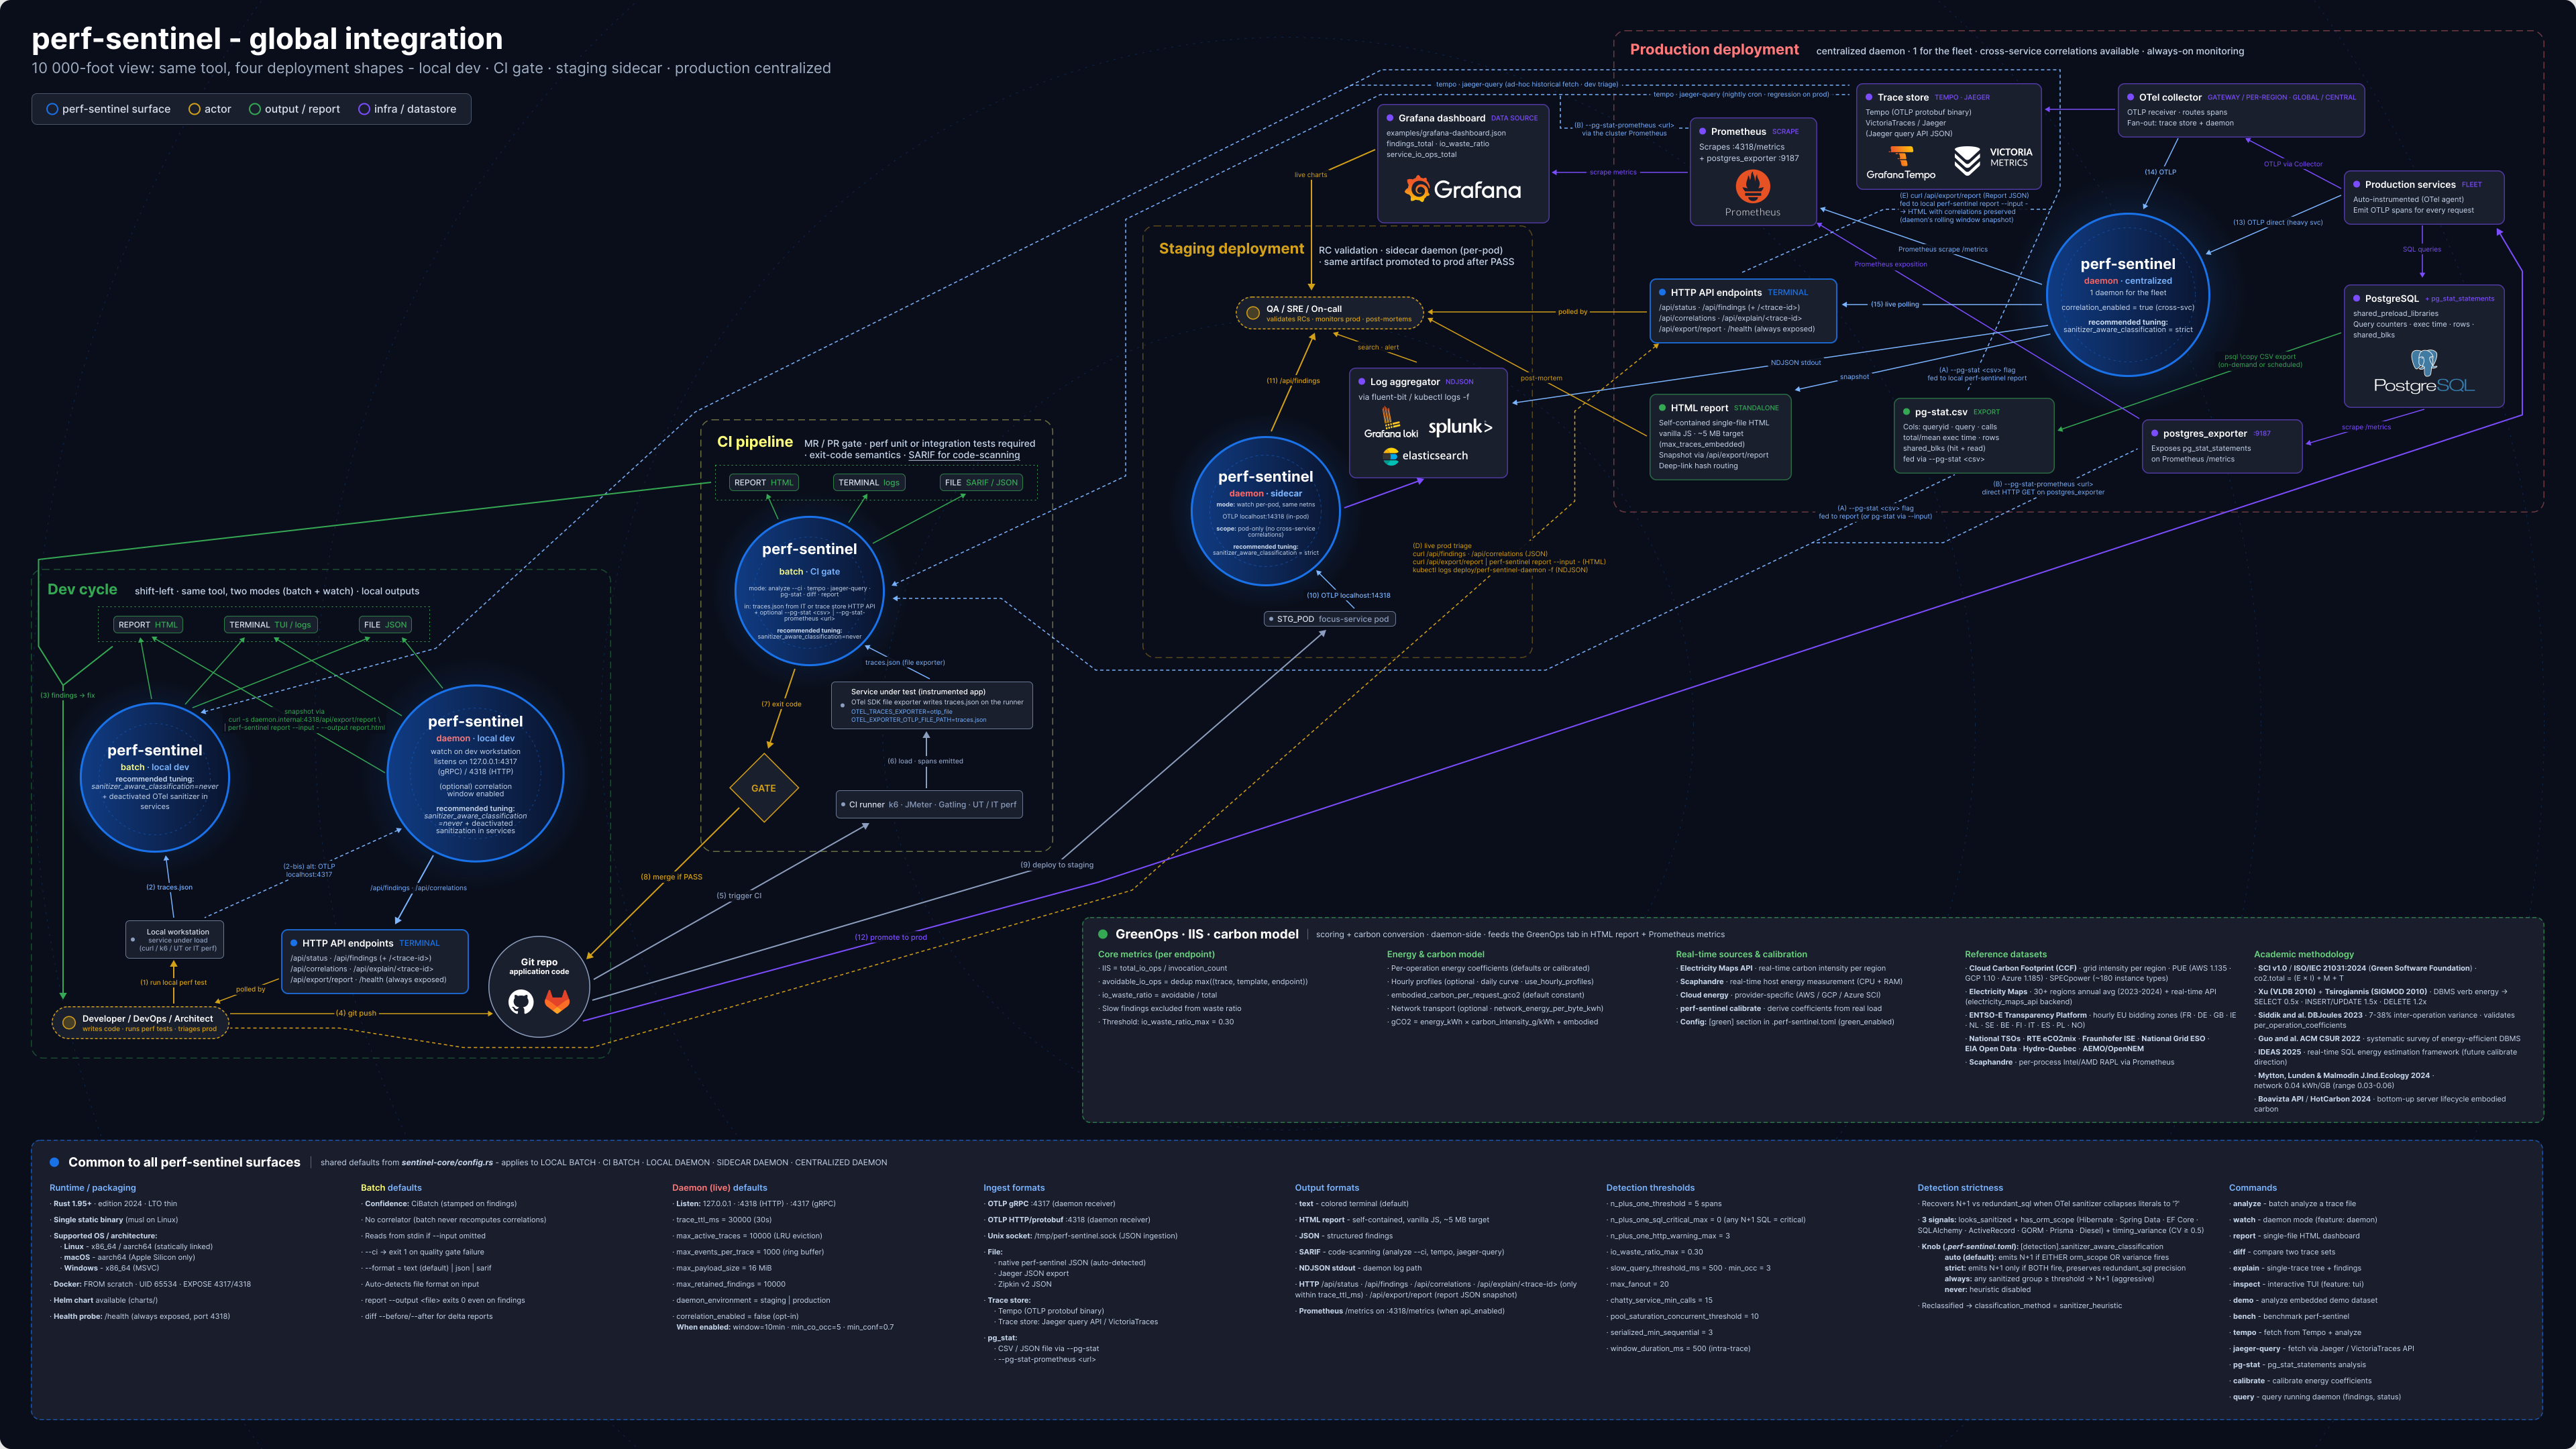
One binary, two modes, four environments, three deployment models. Pick the lightest that fits where your traces live. The central collector is a single stateful daemon, so horizontal replicas need trace-id-aware load balancing and do not share correlation state. Upstream trace sampling (head-based vs tail-based) and the daemon’s own sampling_rate undercount the repetition-based detectors, and under sustained overload the daemon sheds whole analysis batches rather than blocking ingestion, every shed counted in the metrics, never a silent drop.
perf-sentinel analyze --ci on captured traces, exit 1 over a threshold. The simplest gate, nothing long-running.Local dev
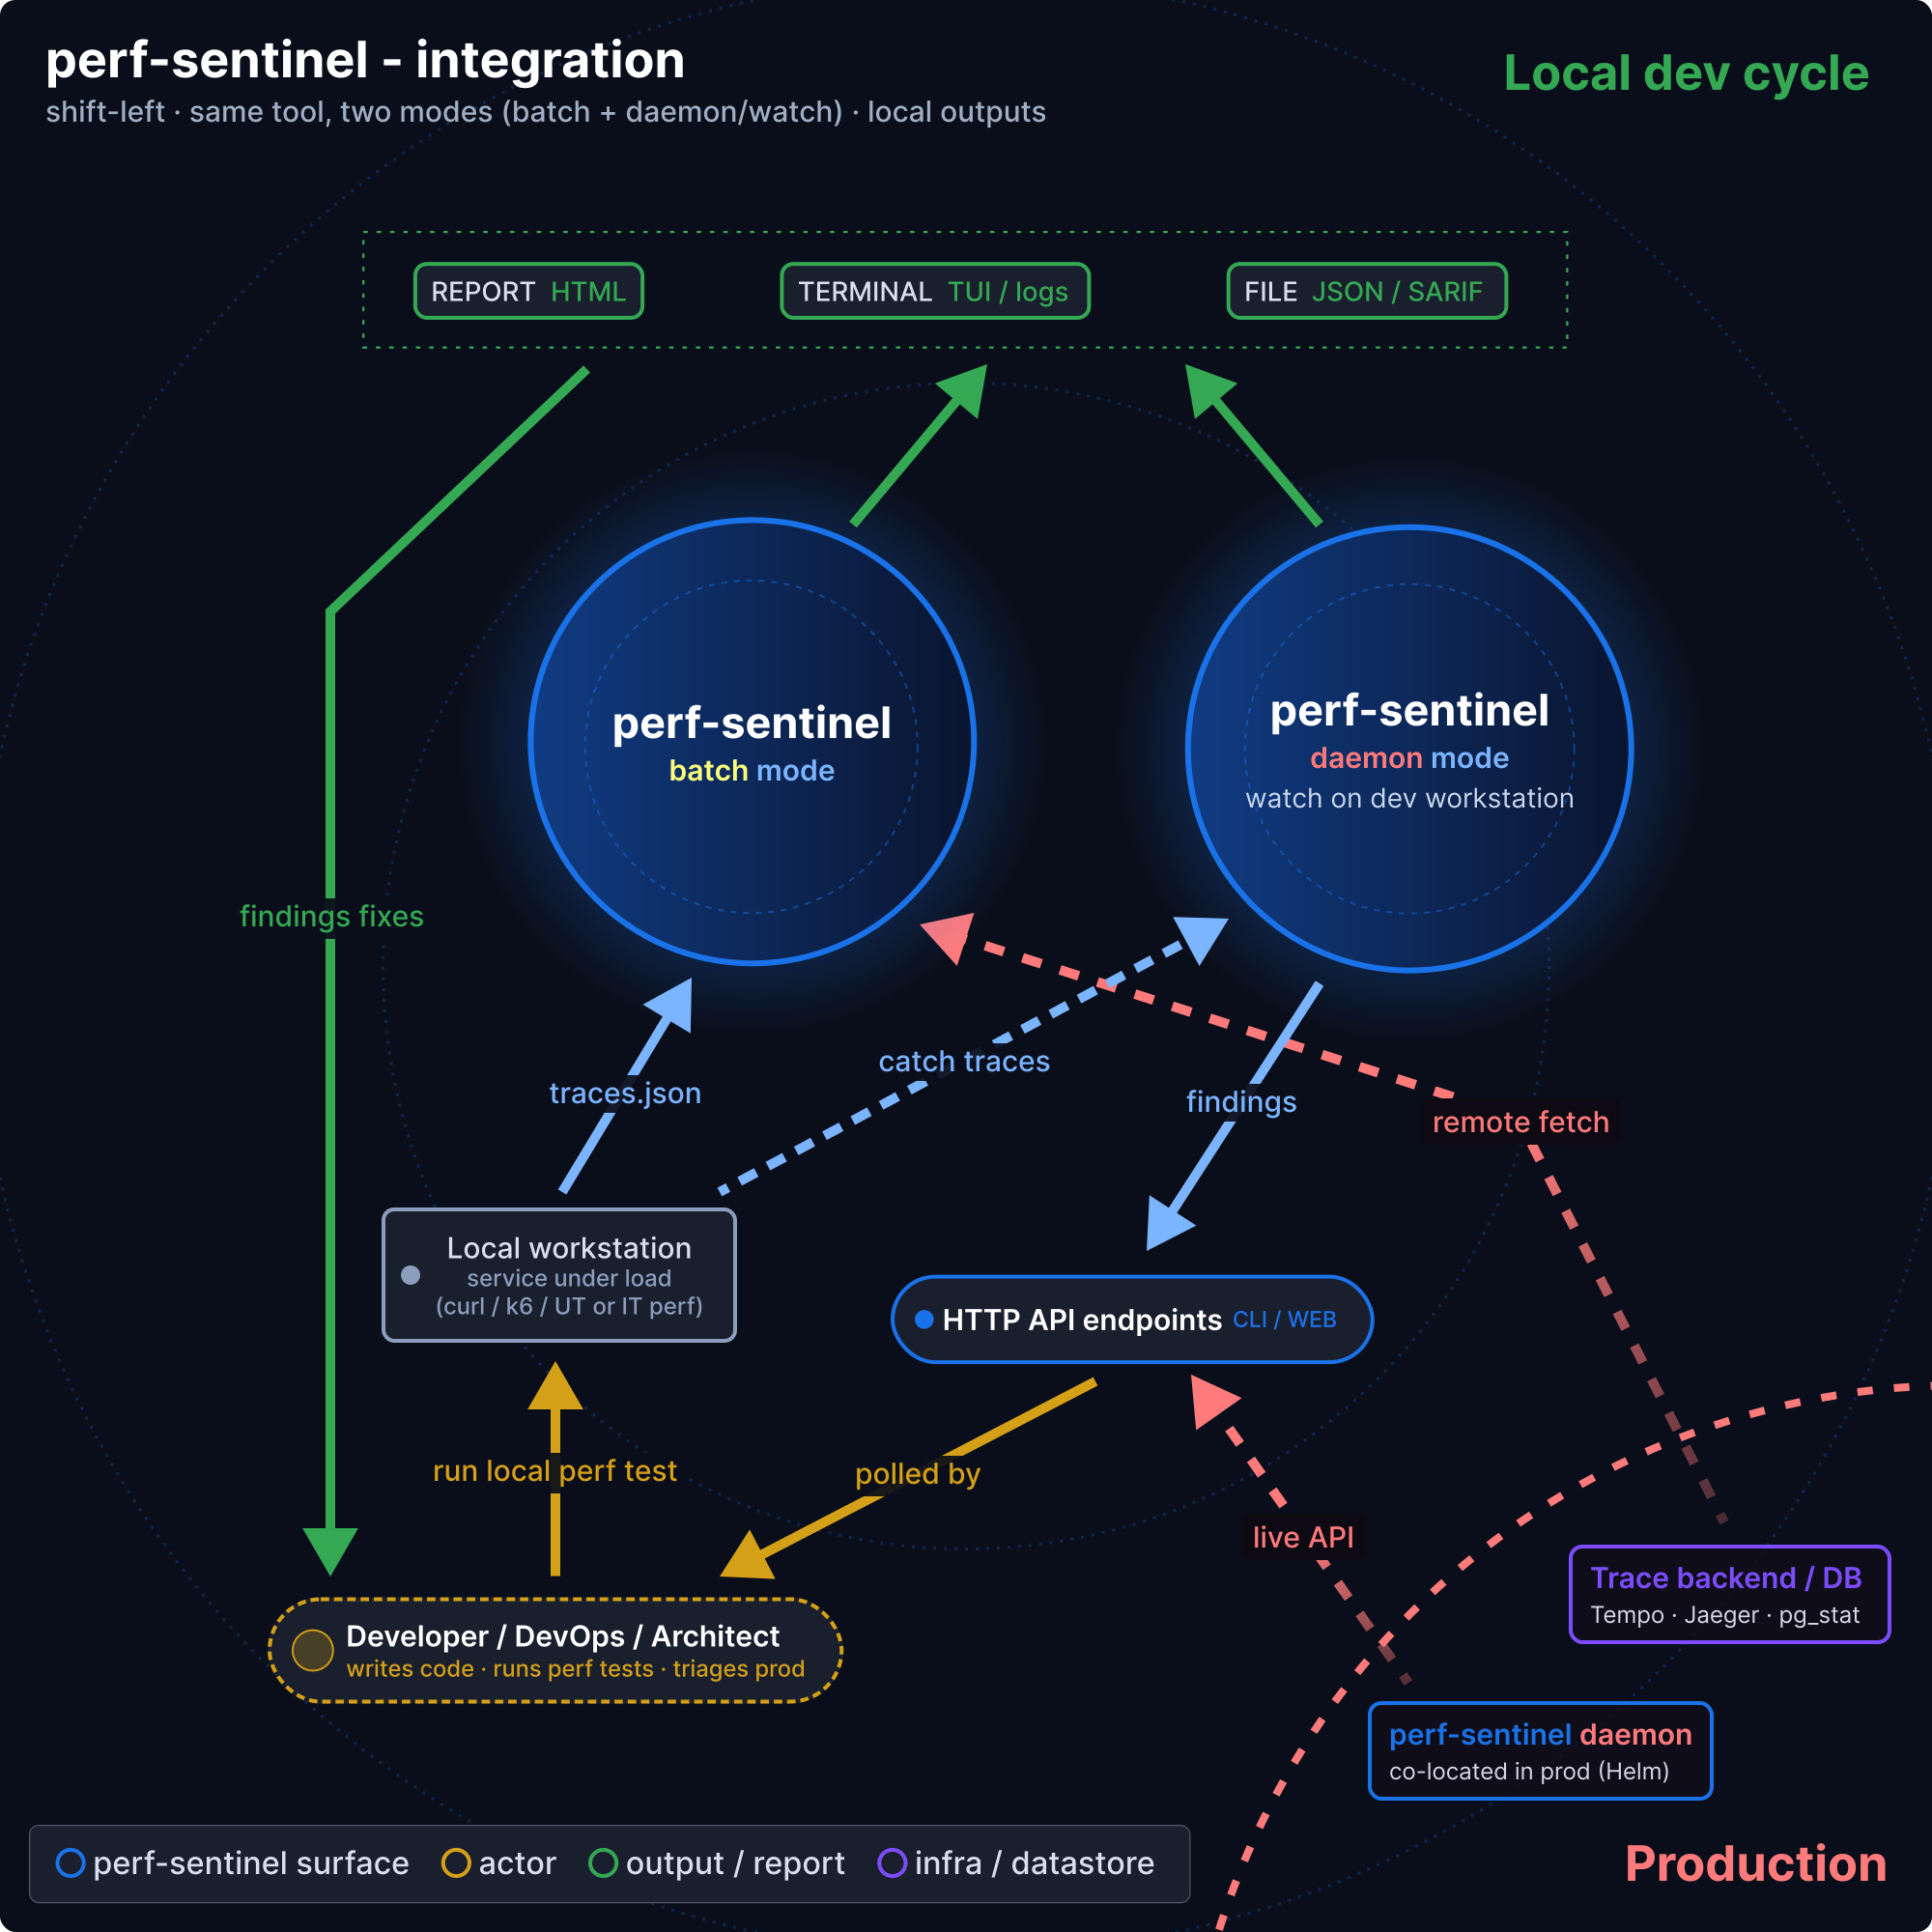
CI/CD
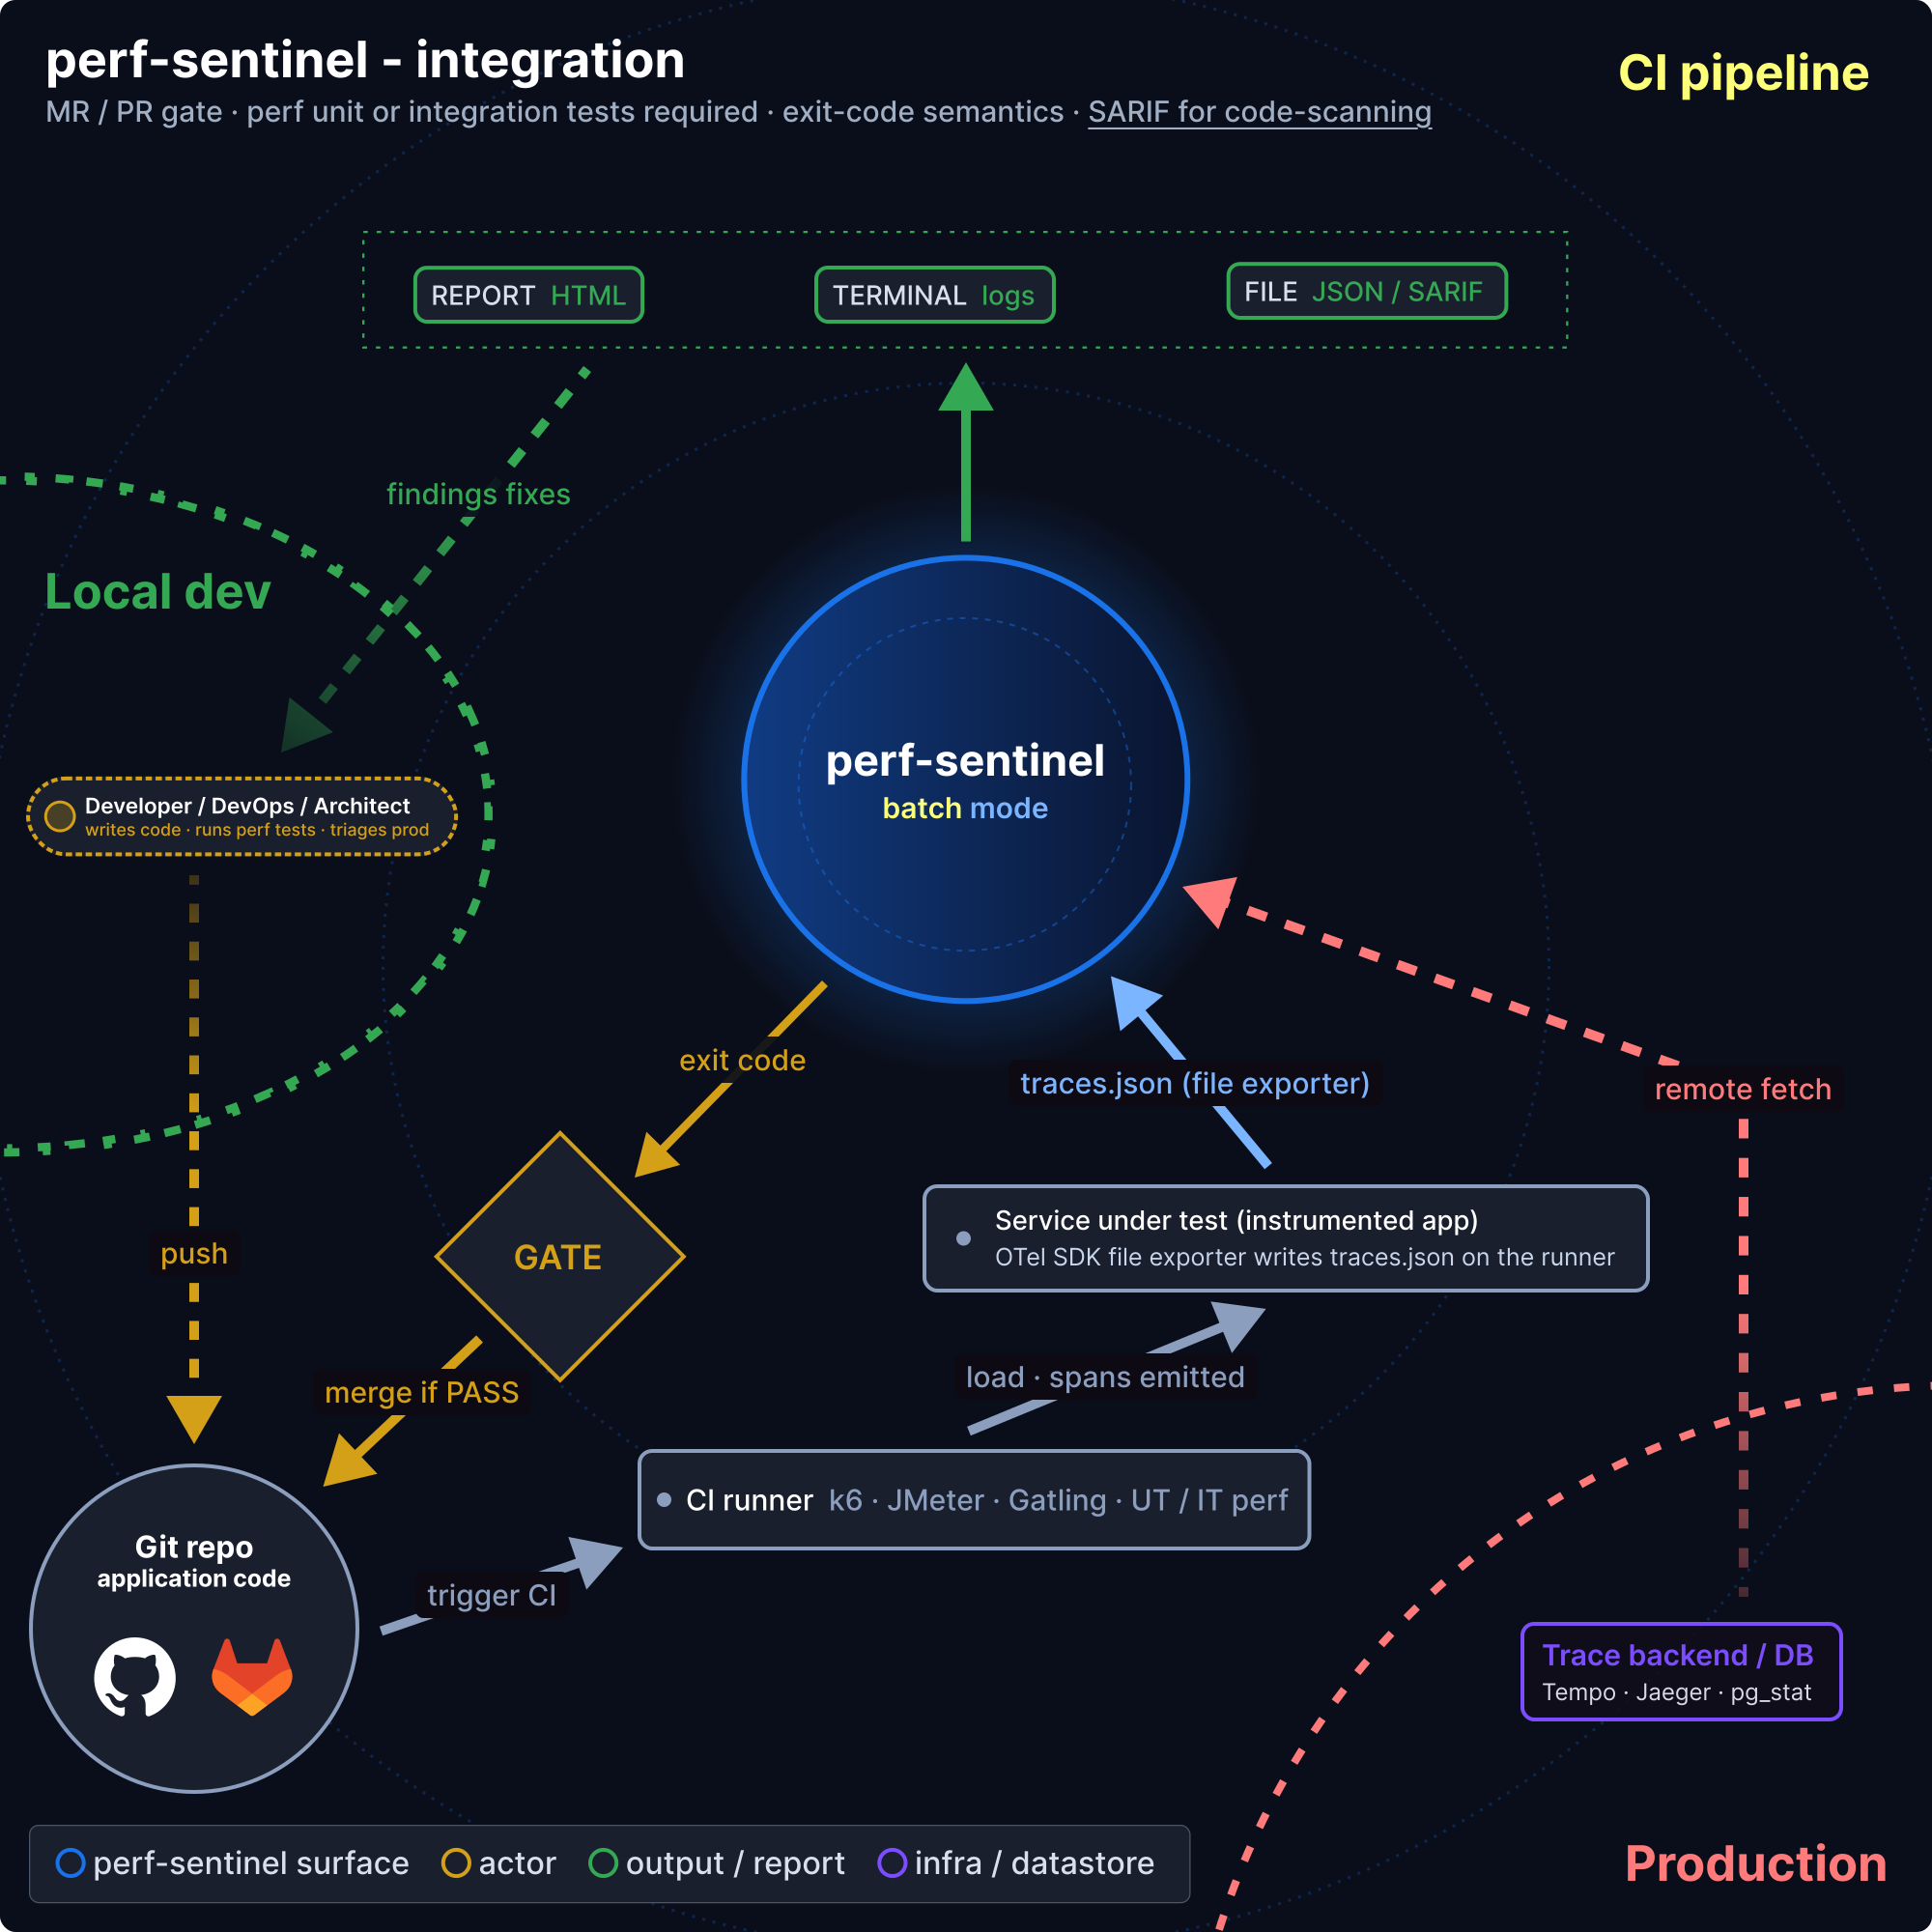
Staging
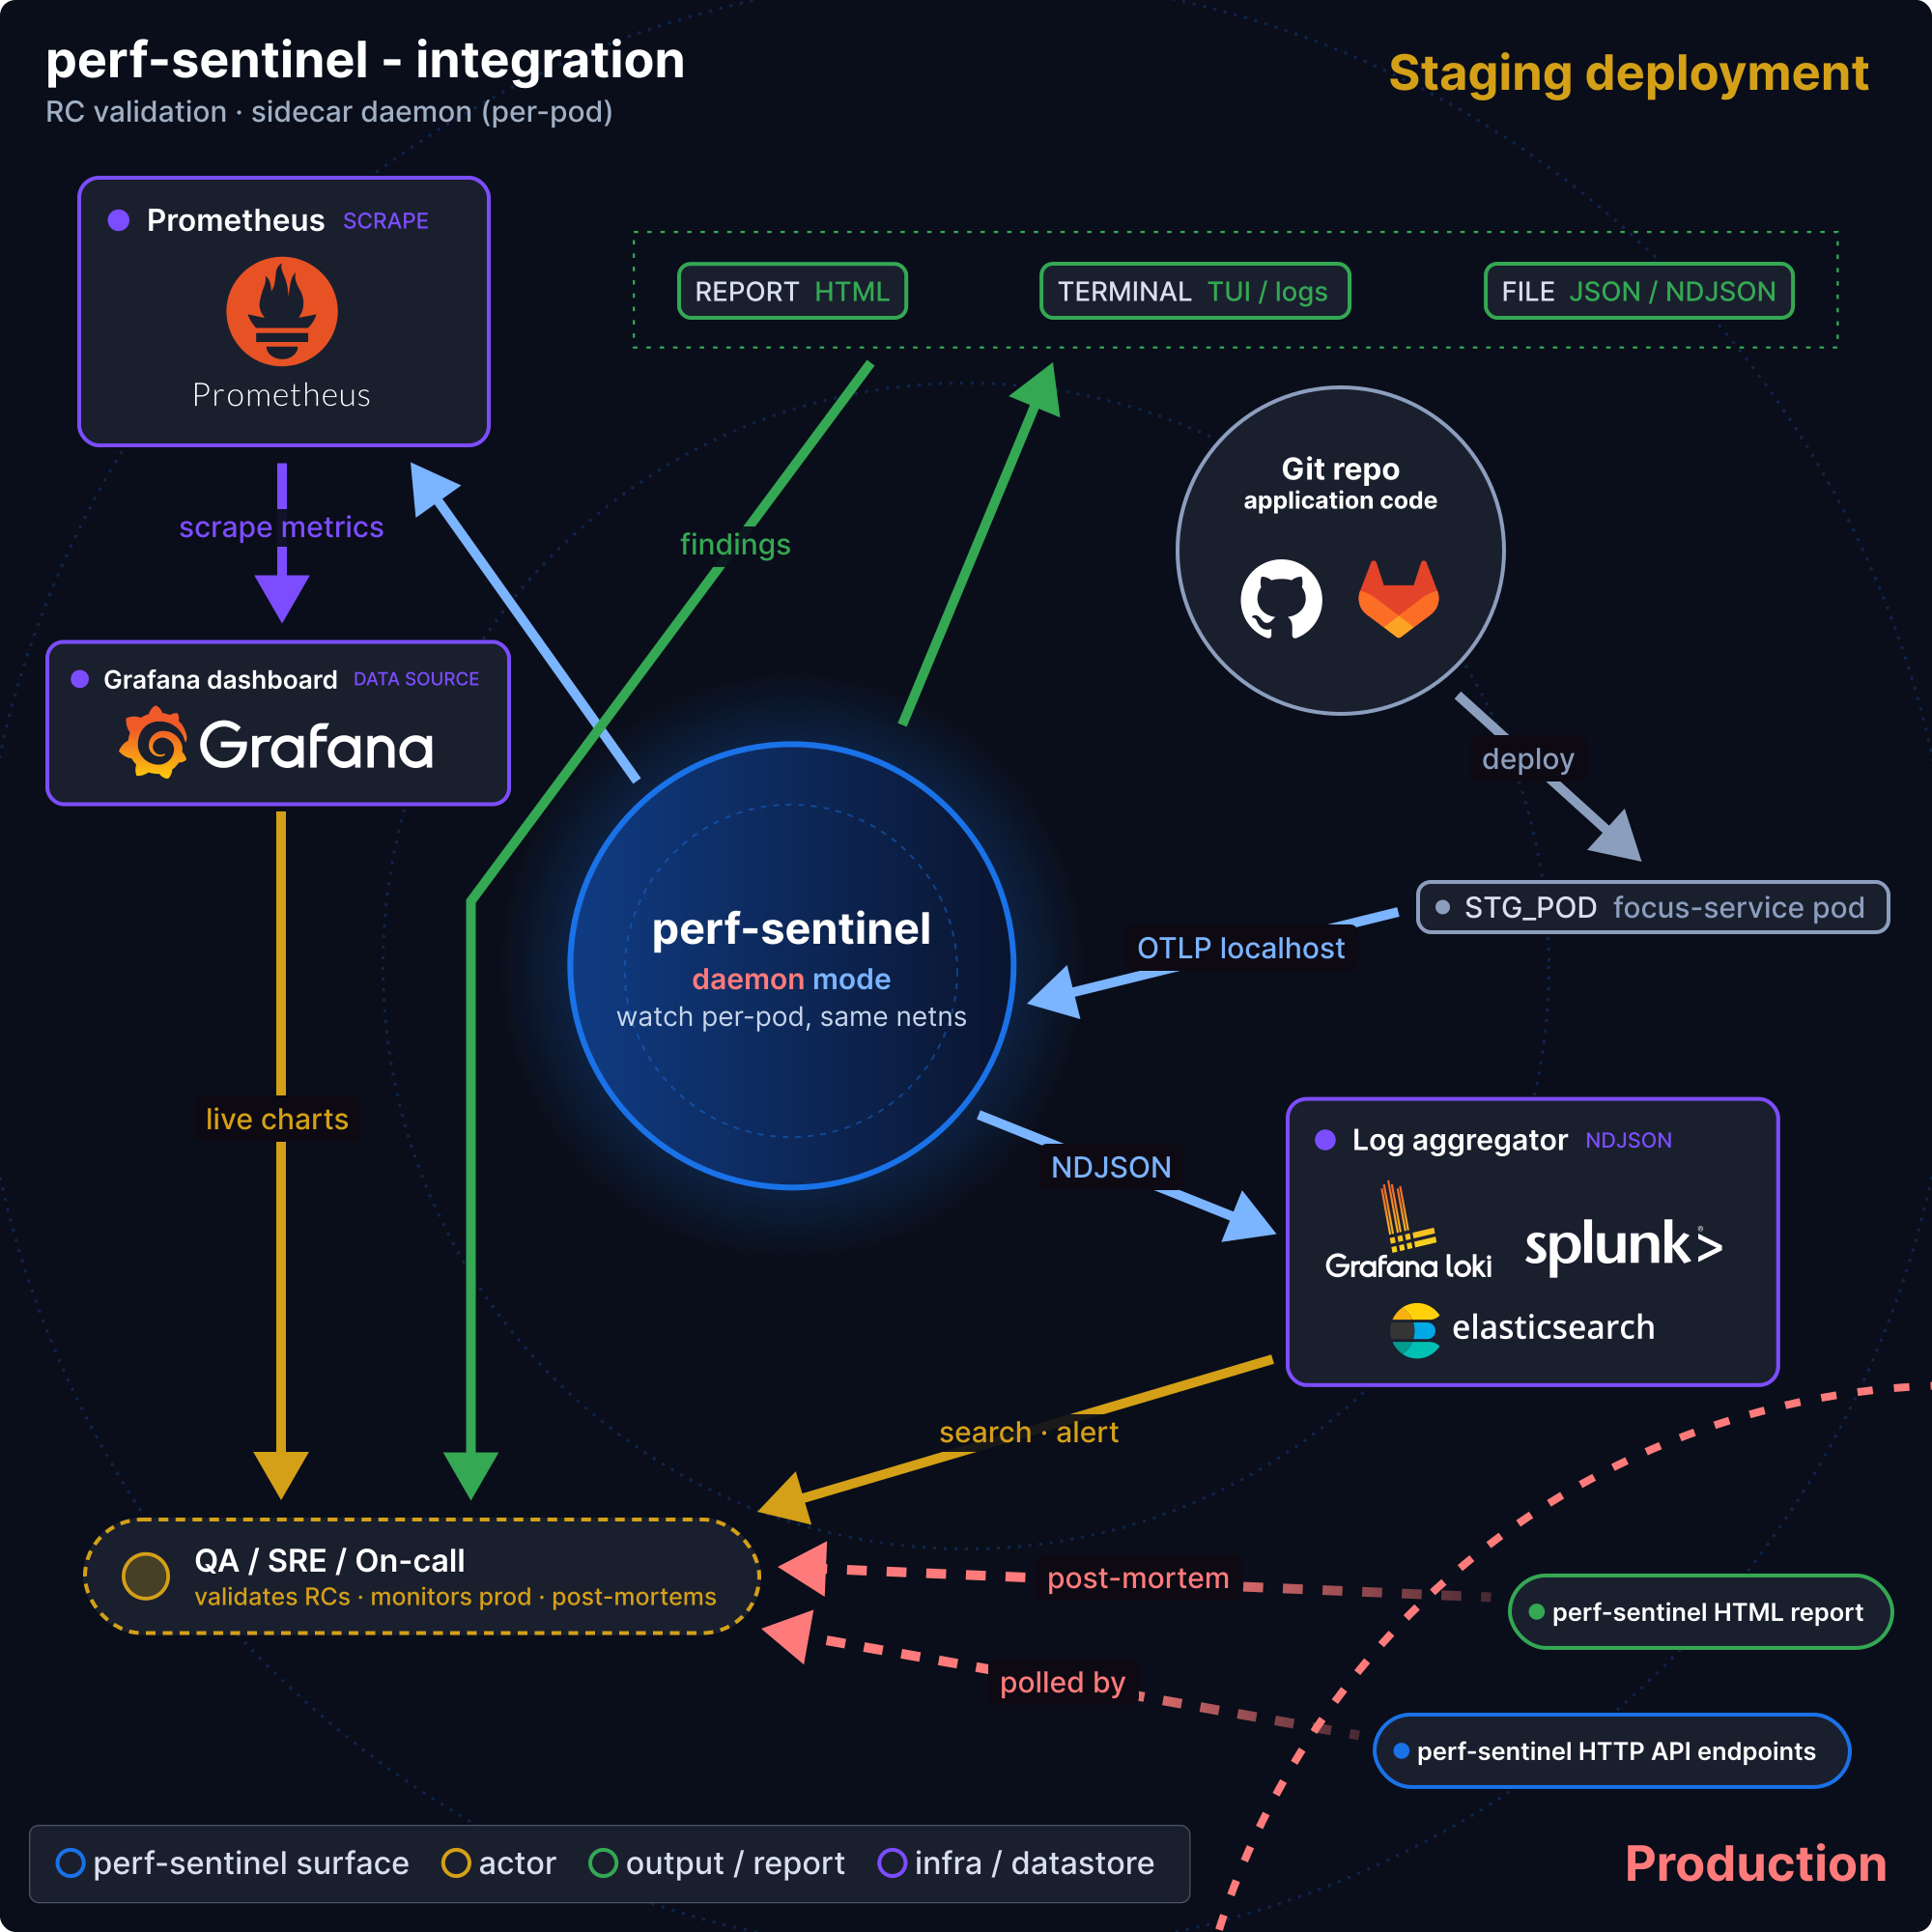
Production
GreenOps (cross-cutting)
End-to-end
Live operator monitor over a running daemon, for DevOps / SRE, four Tab-cycled tabs (Advisor hints, Energy/carbon mix, Trends charts, Scrapers health) via perf-sentinel query --daemon <URL> monitor:
Two example Grafana dashboards ship in the repository rather than in the chart, so neither drifts from the Grafana you already run. The overview reads the Prometheus /metrics counters, the findings one reads the query API through the Infinity plugin, and both carry a Compatibility badge that says when the daemon feeding them is older than their panels need. A collapsed History (Hub) row reads PerfSentinelHub instead, over the time picker’s range, where the daemon’s ring is bounded by volume and cannot look back:
Privacy & security
perf-sentinel is built to sit inside your perimeter and stay quiet.
Supply chain & releases
Every GitHub Action is pinned to a 40-character commit SHA, the production image is FROM scratch, Cargo.lock is committed and audited daily by cargo audit, and workflow token permissions default to read-only. Releases are signed with Sigstore and carry SLSA build provenance.
Releases follow a documented procedure gated by a mandatory simulation-lab run, with the Helm chart versioned in lockstep. Release binaries carry SLSA Build L3 provenance (Sigstore + Rekor) and embedded cargo-auditable data (cargo audit bin), and each release ships an SPDX SBOM attested under the SPDX predicate. Dependabot opens weekly grouped PRs.
Detailed documentation
Every topic above is covered in full in the reference. Jump straight to a page: